Using baseline in a widget - Security Alerts Widget example
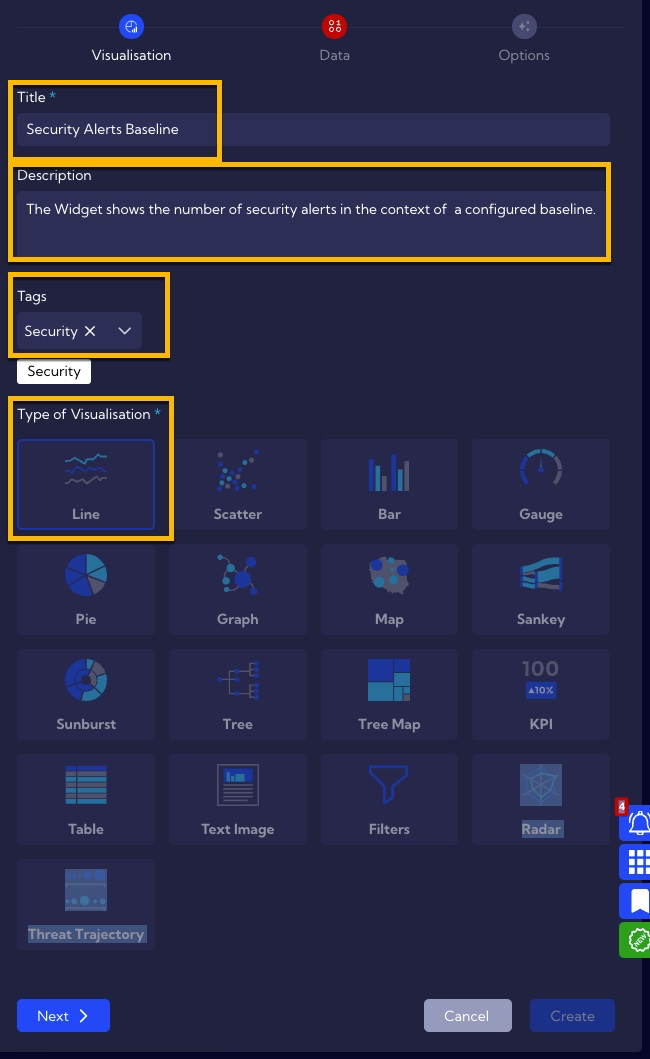
We want to create a Widget that uses baseline functionality. For this purpose we will analyze the widget which is implemented in the system by default - Security Alerts Baseline Widget. It shows the number of security alerts in the context o a configured baseline.
Implementation
Widgets are created and edited in the menu [Dashboard>Management>Widgets]. After entering the tab, in the search field (upper right corner of the window), type the name of the widget - Security Alerts Baseline, and click enter key.

Then you can duplicate the Security Alerts Baseline widget so that it can be edited. To do this, use the Duplicate icon from the Action column.

As you can see, the Widget uses the Line visualization.

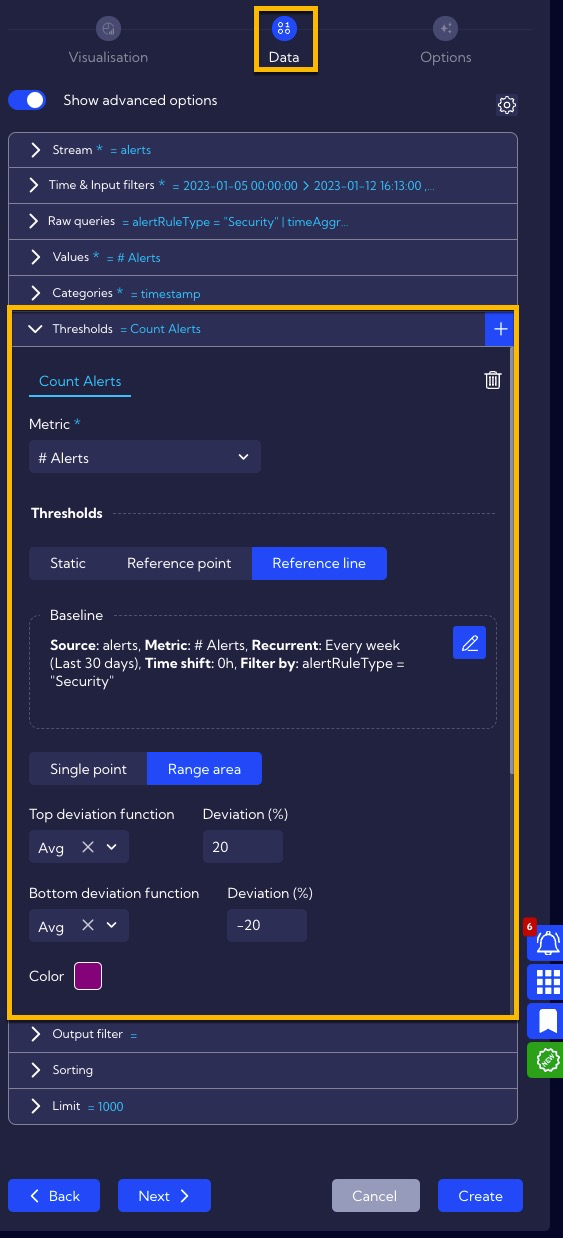
Baseline functionality is mainly configured in the Thresholds section of the Data tab.

Here you set the percentage deviation from the reference, which will be shaded purple.
For the metric configured in the Values section, the baseline can be defined in the Thresholds/Reference line section.

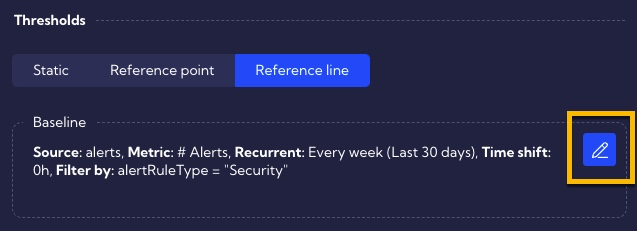
After clicking on the pencil icon, you can configure your baseline.

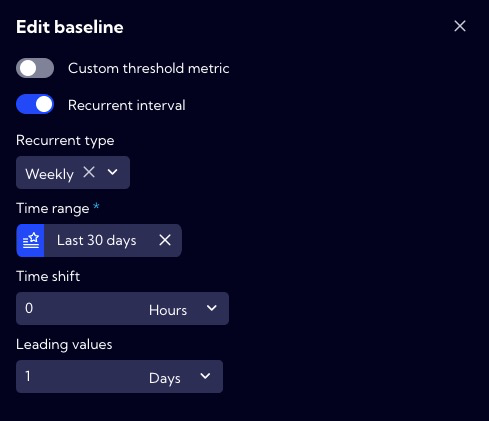
Explanation:
Setting the value Weekly in the Recurrent Type field means that you compare the data from each day of the week to the average of those days, e.g., the current Monday to the average of the previous four Mondays, the current Tuesday to the average of the last four Tuesdays, etc...,
In the Time Range field, you have entered the Last 30 days value, such a time range means that you will have at least 4 samples per each day of the week.
If you want to shift the data in time, you can modify the value in the Time shift field. In our case, leave the default value of 0.
The Leading values setting is the so-called “forward forecast” based on the analysis of previous data. This allows you to draw the expected (estimated) range in which the data should be.